
See QMerse agents at work.

Agent workflows built on the visual canvas, from loading and analysing data to multi-agent orchestration.

Applications

Data

Daily Vehicle Market Monitor

A scheduled agent captures vehicle-market listings every day and stores a dated snapshot for analysis.

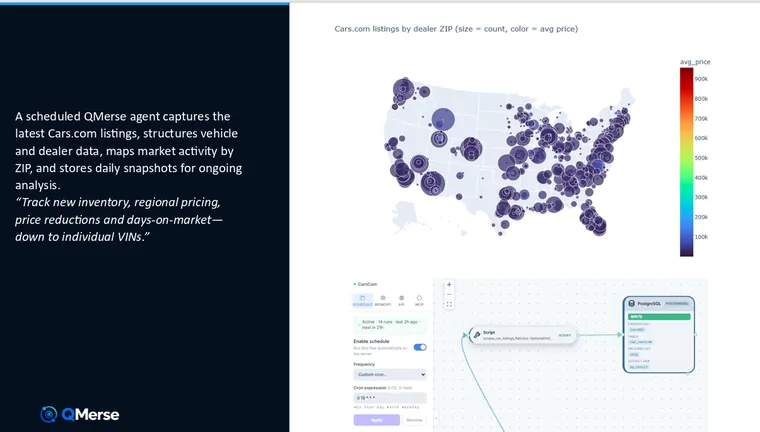
A scheduled QMerse agent captures public vehicle-market listings, structures vehicle and dealer data, maps market activity by ZIP code, and stores a daily snapshot for ongoing analysis. It runs on the server on a cron schedule — nobody opens the canvas to trigger it.

Track new inventory, regional pricing, price reductions and days-on-market — down to individual VINs.

How it is built. A Python script node handles collection and flattening, then writes straight into PostgreSQL. The write is configured to skip on conflict, so a re-run never duplicates rows and the table stays clean whether the flow fires once or fires again after a failure. The schedule is a standard cron expression, so the flow runs unattended and reports its own run history.

Why the schedule is the point. A single scrape is a snapshot; the value is in the accumulation. Because every run appends another dated snapshot, the dataset becomes a time series — and questions that are impossible against one download become straightforward: which ZIPs are discounting fastest, how long a given trim sits before it moves, where a specific VIN has been repriced.

The map shows listings by dealer ZIP, with bubble size as listing count and colour as average price. It is generated from the same workflow that collects the data, so the visualisation stays in step with the table behind it.
Analysis

Property Tax Protest Agent

Finds comparable homes, builds the statistical case and prepares the Texas protest form for you to review.

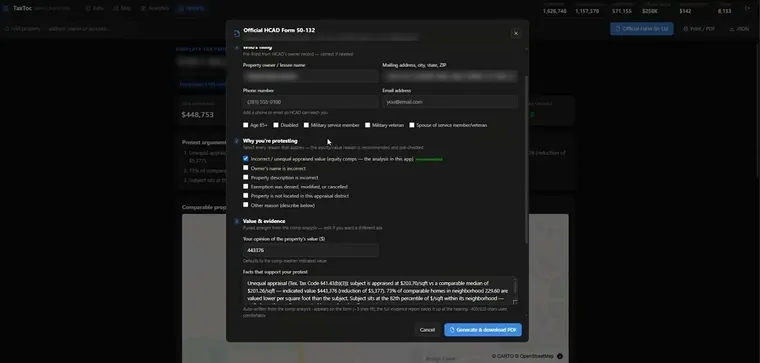
Could your Texas property be over-appraised compared with similar homes in your neighbourhood? This agent connects directly to property databases, analyses comparable homes, and helps a homeowner build an evidence-based tax protest.

End to end, it:

  • Compares your appraised value and price per square foot against similar nearby homes
  • Runs the mathematical and statistical analysis needed to detect over-appraisal
  • Identifies the most relevant comparable properties
  • Plots the subject property and its comparables on an interactive map
  • Estimates a supported value, the potential assessment reduction and the possible tax saving
  • Generates an evidence report with charts, maps and protest arguments
  • Prepares the official Texas protest form for you to review and submit

The last step is the one that matters. Most AI stops at analysis and leaves a person to do the paperwork. This carries it through to a completed, ready-to-submit form and an evidence pack — not a summary of what you could do next. You review it and file it yourself; that is the difference between something interesting and something a homeowner actually uses.

Behind the front end, agents designed and orchestrated in QMerse manage the whole chain: database queries, calculations, analytics, mapping and automated report generation. It is a good example of a data-intensive process that nobody enjoys, turned into an application that produces a clear, actionable result.

This demonstration is for informational purposes and does not constitute tax or legal advice. Any generated analysis or form should be reviewed before submission, and a successful protest or tax saving is not guaranteed.

Geospatial

AI Real Estate Agent

Ask in plain language: the agent queries the housing database, filters the results and moves the map.

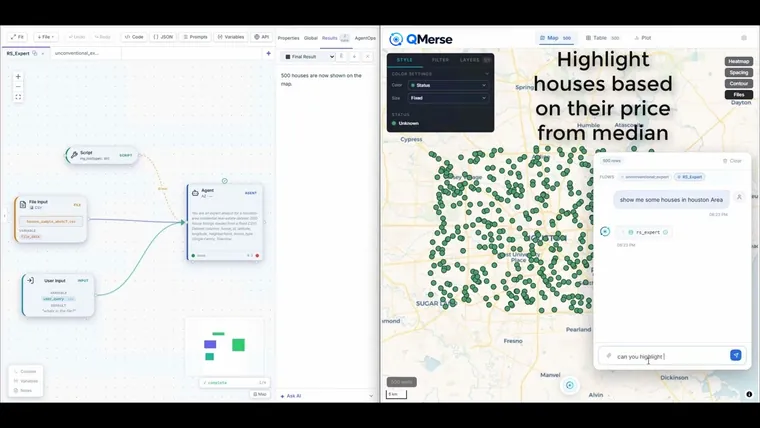
An agent connected to a Houston housing database, deployed as an application people can actually use. You ask in plain language — “Show me houses in the Houston area”, “Highlight homes priced below the median” — and the agent analyses the data, returns the results, and updates the interactive property map in real time.

The demo shows both halves at once. On the left is the QMerse visual workspace, where the agents, tools, data inputs and workflows are designed and orchestrated. On the right is the user-facing application: the conversational interface and the property map your end user actually touches. You can watch a request travel from the canvas that was built to the screen a customer is looking at.

What the agent coordinates behind that interface: understanding the request, querying the database, filtering the results, and controlling the map. Note the last one — the agent is not just returning rows for someone else to render. It is operating the application.

The pattern generalises well beyond property. Most organisations have a database that only two or three people know how to query, so the data is available in principle and unreachable in practice. This is the shape of the fix: an agent that can talk to a database, drive an application, and control a visual interface on the user’s behalf.

Geospatial

Critical Minerals Intelligence Agent

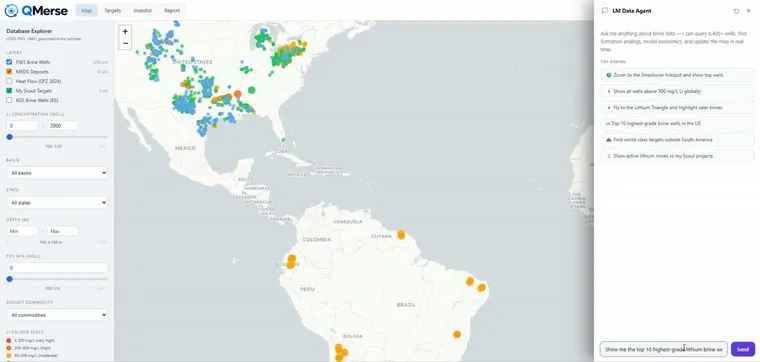
Ask for the top lithium brine wells: the agent queries geological databases, ranks them and drives the map.

A critical-minerals intelligence application powered by agents designed and orchestrated on the QMerse canvas. It connects directly to multiple geological and mineral databases, and users talk to that data in plain language while the agent runs the analysis and takes actions inside the application.

What the agent does:

  • Searches and analyses lithium brine wells and mineral deposits
  • Identifies and ranks high-grade lithium opportunities
  • Compares concentration, depth, location and other technical attributes
  • Explores regions such as the United States and the South American Lithium Triangle
  • Combines information across several geological datasets at once
  • Filters, navigates and updates the interactive map automatically
  • Supports early-stage technical and commercial feasibility assessment
  • Saves selected opportunities and generates structured reports for investors

The front end is a real application — an interactive geospatial map, a database explorer and a conversational interface. Behind it, QMerse agents coordinate the database queries, the analytical tools, the map actions, the visualisation and the reporting. The agent does not just answer; it operates the application on your behalf.

This is what turns a complex geoscience dataset into a decision-support system that explorers, mining companies, investors and government bodies can all use — without each of them needing to know how to query it.

This application supports preliminary screening and decision-making. Its outputs do not constitute geological, financial or investment advice, and any opportunity should undergo independent technical and commercial due diligence.

Workflow patterns

Analysis

Batch Topic Analyser

A list of topics in, one investment report out.

A loop works through a list of topics one at a time and hands back a single report.

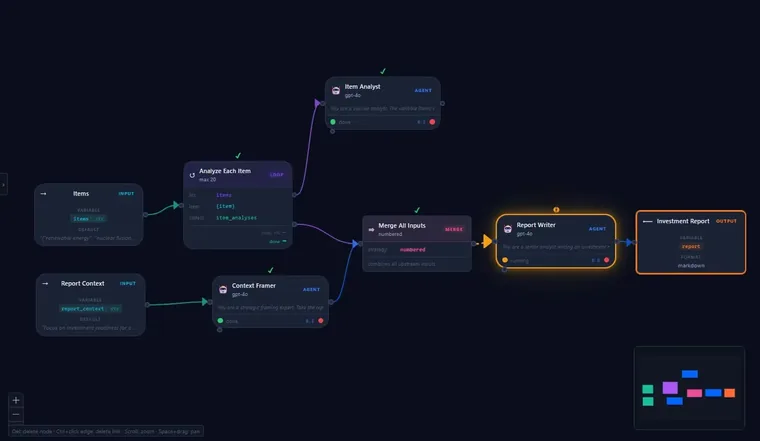
How it works: a loop runs an Item Analyst agent over every topic in the list (up to 20), a Context Framer agent sets the brief, and a Report Writer agent merges both into one investment report.

Flow: Items → Loop (each item) → Item Analyst; Report context → Context Framer → Merge → Report Writer → Investment report.

Data

Data Loader Agent

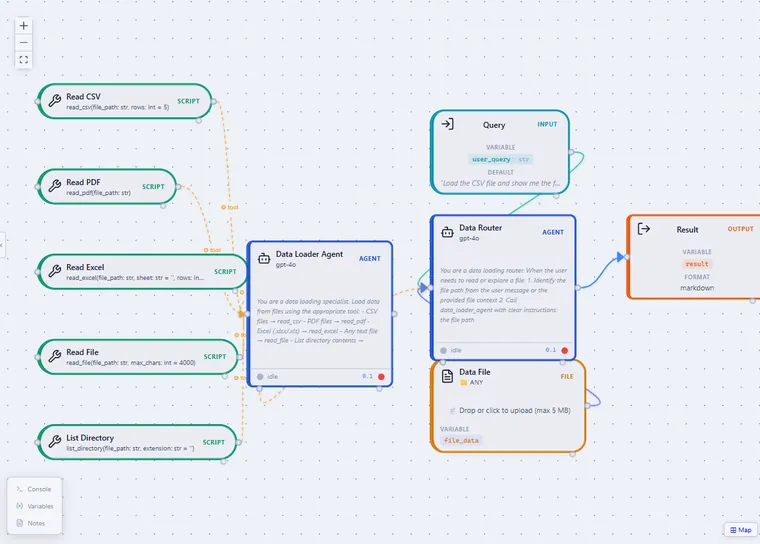
Load data from CSV, PDF, or Excel — the agent picks the right reader automatically.

A data-loading router reads the user request and the uploaded file, then calls the matching tool to pull the content in.

How it works: the Data Router inspects the file path and type, then delegates to a Data Loader Agent equipped with read_csv, read_pdf, read_excel, read_file and list_directory tools — returning clean markdown.

Flow: Query + Data File → Data Router → Data Loader Agent → Result.

Orchestration · Worked concept

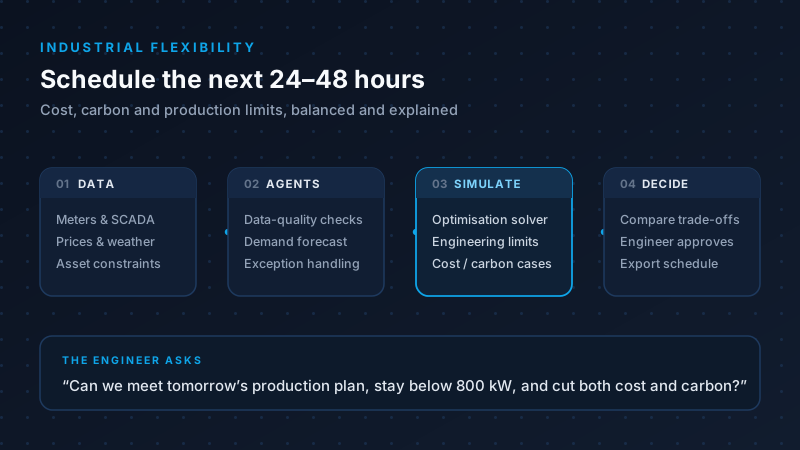
Industrial Flexibility Scheduling

Schedule batteries, heat pumps and flexible production over 24–48 hours, balancing cost, carbon and limits.

Industrial sites are being asked to electrify without breaking their production plan. The levers exist — battery storage, load shifting, interruptible loads, batch rescheduling, onsite solar — but they sit across separate systems, and cost, carbon and output constraints all pull in different directions. Deciding what to run tomorrow is a judgement call made under time pressure.

The workflow. Connect site data (meters and SCADA, asset constraints, the production plan) alongside price and weather forecasts. Agents handle the messy part — data-quality checks, demand forecasting, orchestrating scenarios and catching exceptions. A deterministic optimisation solver then calculates the actual schedule against real engineering limits, and cost-first, carbon-first and balanced cases are compared side by side with their uncertainty.

The division of labour is the point. The AI coordinates data, tools and explanations. It does not invent the answer: the solver enforces the engineering constraints, and a named engineer approves the schedule before anything is exported. Every recommendation carries its inputs and assumptions, so it can be checked rather than trusted.

An engineer asks: “Can we meet tomorrow’s production plan, stay below 800 kW, and cut both cost and carbon?” — and gets a schedule, the trade-offs behind it, and a record of why.

Worked concept. This describes a workflow design, not a deployed installation — a bounded prototype can validate the data-to-decision loop on synthetic or anonymised site data, with no autonomous control, before anything is connected to a plant.

Have a workflow in mind?

Start free and build it on the canvas, or ask us a question about the platform first.